Table of Contents
- Introduction
- Understanding the T3 Moving Average
- Calculation Method
- Input Parameters
- Usage Guide
- Get the Code
- Conclusion
Introduction
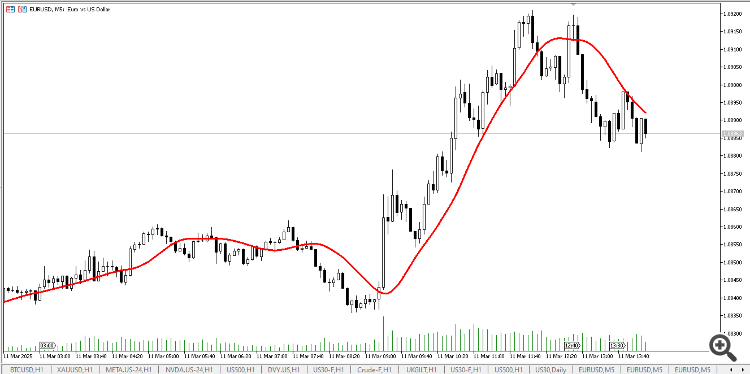
The T3 Moving Average is an advanced technical indicator developed by Tim Tillson that offers a superior alternative to traditional moving averages. It achieves an optimal balance between responsiveness to price movements and noise filtering, making it an excellent tool for technical analysis.
Understanding the T3 Moving Average
The T3 Moving Average stands out from traditional moving averages due to its unique characteristics:
- Reduced Lag: Responds more quickly to genuine price movements
- Smooth Curve: Effectively filters out market noise
- Adaptive Nature: Combines multiple EMAs for better price action representation
- Customizable Smoothing: Adjustable volume factor for fine-tuning responsiveness
Calculation Method
The T3 Moving Average uses a sophisticated calculation method that involves multiple steps:
- EMA Cascade: Six sequential EMAs are calculated, where each EMA takes the output of the previous EMA as input
- Weighted Combination: The final T3 value is calculated using a weighted combination of four EMAs:
|
|
Where the coefficients are:
- c1 = -factor³
- c2 = 3factor² + 3factor³
- c3 = -6factor² - 3factor - 3*factor³
- c4 = 1 + 3factor + factor³ + 3factor²
Input Parameters
1. T3 Length
Parameter: T3_Length
Default: 12
Description: Period length for the EMAs
Impact: Longer periods create smoother lines but increase lag
2. T3 Factor
Parameter: T3_Factor
Default: 0.7
Description: Volume factor that controls the balance between smoothness and responsiveness
Range: 0 to 1
Effects:
- Higher values (closer to 1): Smoother lines with more lag
- Lower values (closer to 0): More responsive lines with less lag
Usage Guide
The T3 Moving Average can be used in various ways for technical analysis:
1. Trend Identification
- Uptrend: Price above T3 line
- Downtrend: Price below T3 line
- Trend Strength: Steeper T3 slope indicates stronger trend
2. Trading Signals
- Buy Signal: Price crosses above T3 line
- Sell Signal: Price crosses below T3 line
- Confirmation: Use with other indicators for stronger signals
3. Support and Resistance
- T3 line can act as dynamic support/resistance
- Multiple timeframe analysis for stronger levels
- Price reactions at T3 line indicate its strength
4. Noise Filtering
- T3 helps identify genuine price movements
- Reduces false signals from market noise
- Useful for swing trading and position trading
Get the Code
The T3 Moving Average indicator is available for free on GitHub. You can download and use it in your projects:
GitHub Repository: T3_Moving_Average
The repository contains:
- Complete source code of the T3 Moving Average indicator
- Example usage
- Documentation
- Free to use in your projects
Installation
- Download the indicator file from the GitHub repository
- Place the file in your MetaTrader 5 indicators folder:
C:\Users\[YourUsername]\AppData\Roaming\MetaQuotes\Terminal\[YourTerminalID]\MQL5\Indicators\
- Restart MetaTrader 5 or refresh the Navigator window
- Drag and drop the indicator onto any chart
- Adjust the input parameters to suit your trading strategy
Conclusion
The T3 Moving Average is a powerful technical indicator that offers several advantages over traditional moving averages:
- Superior responsiveness to price movements
- Effective noise filtering
- Customizable smoothing
- Multiple trading applications
Important Note: Like all technical indicators, the T3 Moving Average should be used as part of a comprehensive trading strategy. Always combine it with other analysis tools and proper risk management.