Table of Contents
- Overview
- Key Features
- Video Tutorial
- Installation Guide
- Usage Guide
- Parameters
- Trading Strategies
- Contact & Support
Buy
| Price | $39 |
| MT5 Version | Buy MT5 Version |
| MT4 Version | Buy MT4 Version |
| Crypto |
Pay with Bitcoin, Ethereum, or other cryptocurrencies.
⚠️ Warning: Please enter your correct email address. The product download link will be sent to this email after payment. |
Overview
The Camarilla Pivot Points indicator is a powerful math-based price action analysis tool that generates precise intraday support and resistance levels. Available for both MetaTrader 4 and MetaTrader 5, this professional indicator helps traders identify key price levels for better entry and exit points.
Key Features
- Dual Platform Support: Works on both MT4 and MT5
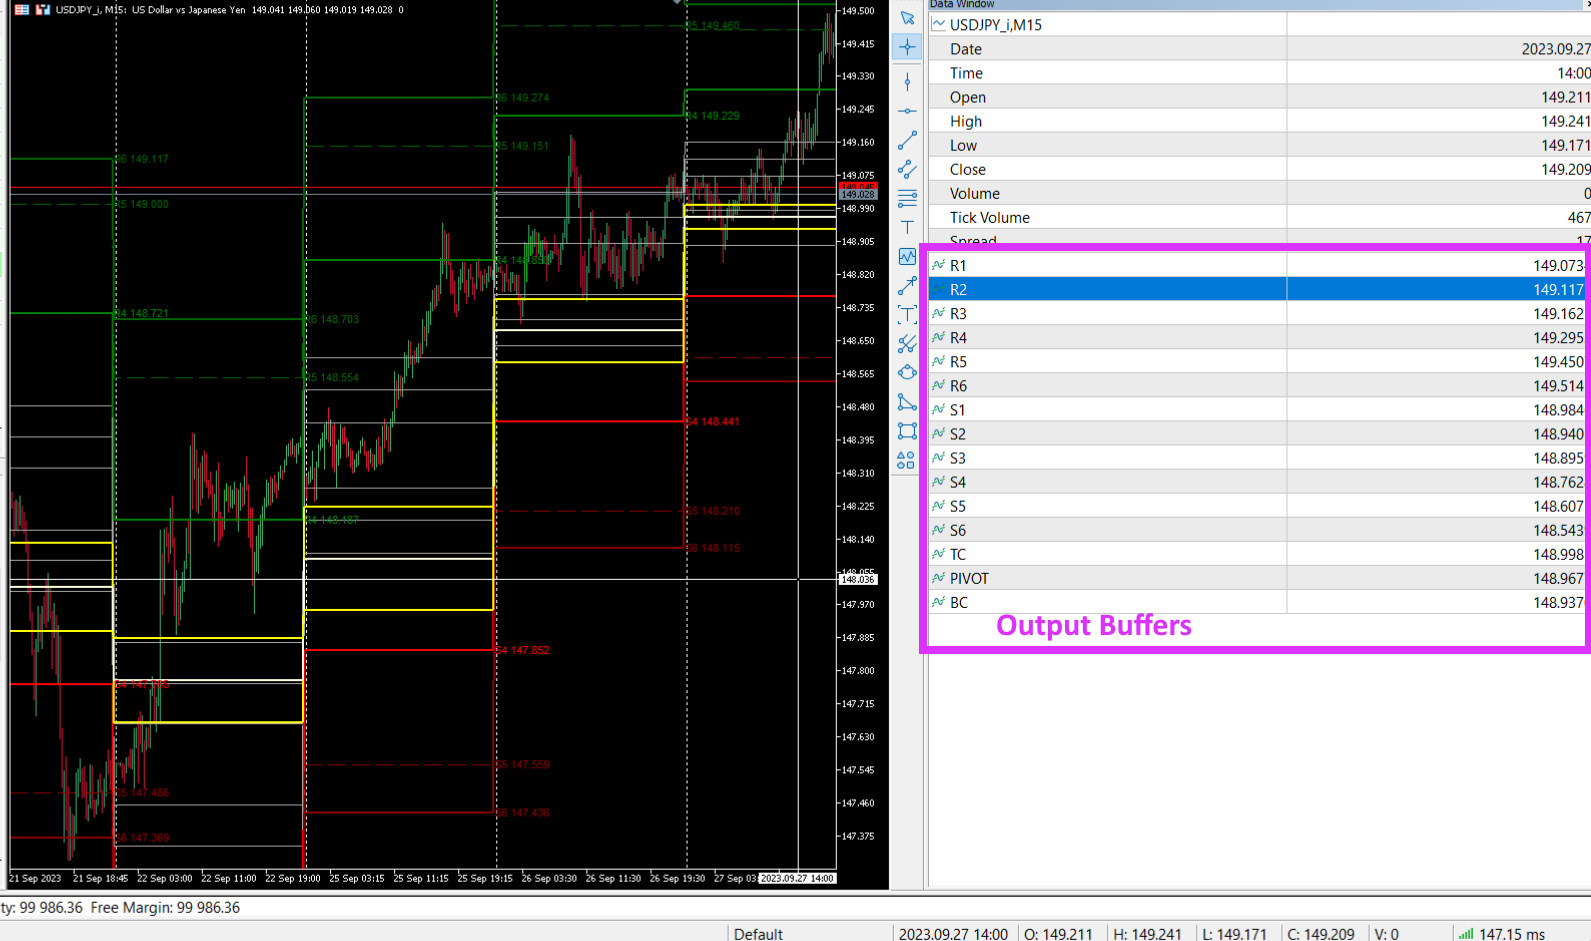
- Automated Trading Ready: Output buffers for EA integration
- Customizable Time Ranges: Multiple symbol types supported
- New York Time Based: Accurate calculations for global markets
- Visual Customization: Adjustable display options
- Multiple Asset Support: Works with forex, stocks, indices, and more
- Precise Calculations: Based on mathematical formulas
Video Tutorial
Watch our comprehensive video tutorial to see the Camarilla Pivot Points in action:
Installation Guide
- Purchase via MQL5 Market or using the crypto payment option above
- Download and extract the files
- Copy the files to your MT4/MT5 installation directory:
- MT4:
Terminal_Directory\MQL4\Indicators\ - MT5:
Terminal_Directory\MQL5\Indicators\
- MT4:
- Restart MetaTrader or refresh the Navigator panel
- Find the indicator in the Navigator panel under “Indicators”
Usage Guide
Manual Trading
- Support Levels: Look for buying opportunities at support levels
- Resistance Levels: Look for selling opportunities at resistance levels
- Breakout Trading: Trade breakouts of key levels
- Range Trading: Trade bounces between levels
Automated Trading
- EA Integration: Use indicator values in your Expert Advisors
- Custom Strategies: Develop your own trading systems
- Signal Generation: Create automated entry and exit signals
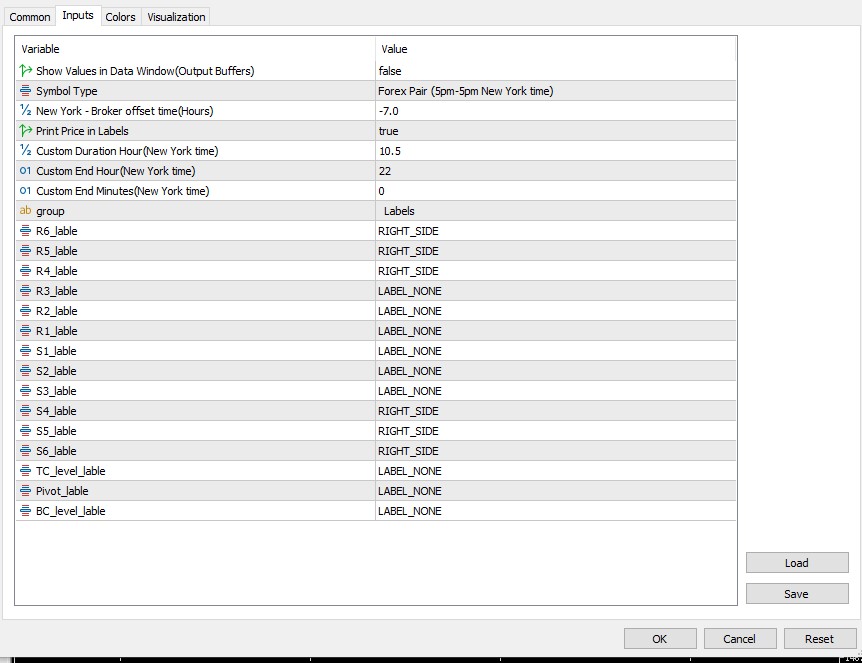
Parameters
Show Values in Data Window
- Type: Boolean (true/false)
- Default: false
- Description:
true: Generates output data for EA integrationfalse: Produces visually appealing plots for manual trading
Symbol Type
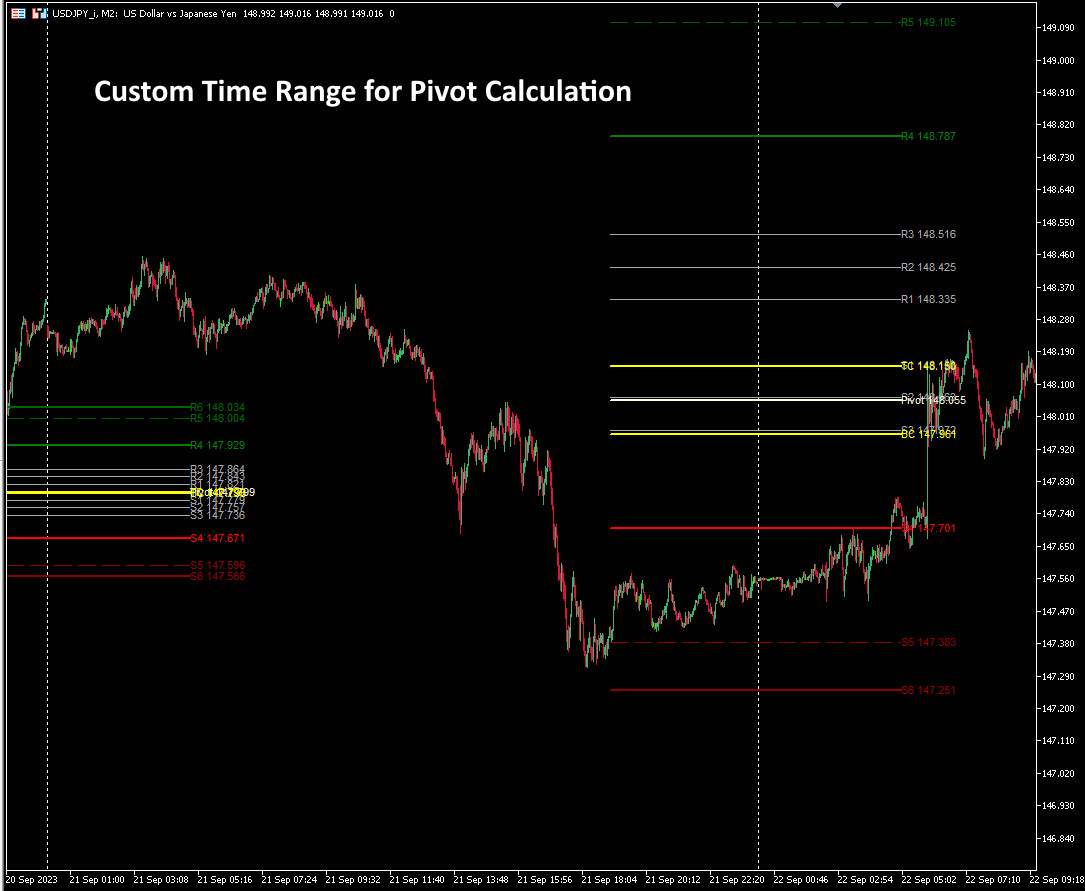
- Options: Stock/ETF, Forex Pair, Index/Gold/Silver, Custom Time Range
- Description: Determines the time period for pivot point calculations
- Time Ranges:
- Stock/ETF: 9:30 am - 4:00 pm New York time
- Forex Pair: 5:00 pm - 5:00 pm New York time
- Index/Gold/Silver: 6:00 pm - 6:00 pm New York time
- Custom Time Range: User-defined period
New York - Broker Offset
- Type: Integer
- Description: Time offset between New York time and broker’s time
- Usage: Essential for accurate calculations
Print Price
- Type: Boolean (true/false)
- Default: true
- Description: Display pivot prices near the levels
Custom Time Range Parameters
- Custom Period Hour: Start hour for custom time range
- Custom End Hour: End hour for custom time range
- Custom End Minutes: End minutes for custom time range
- Usage: Required when Symbol Type is set to Custom Time Range
Trading Strategies
Basic Strategy
-
Support Level Trading:
- Buy when price approaches support levels
- Set stop loss below the support level
- Take profit at the next resistance level
-
Resistance Level Trading:
- Sell when price approaches resistance levels
- Set stop loss above the resistance level
- Take profit at the next support level
Advanced Strategies
For more detailed trading strategies, visit:
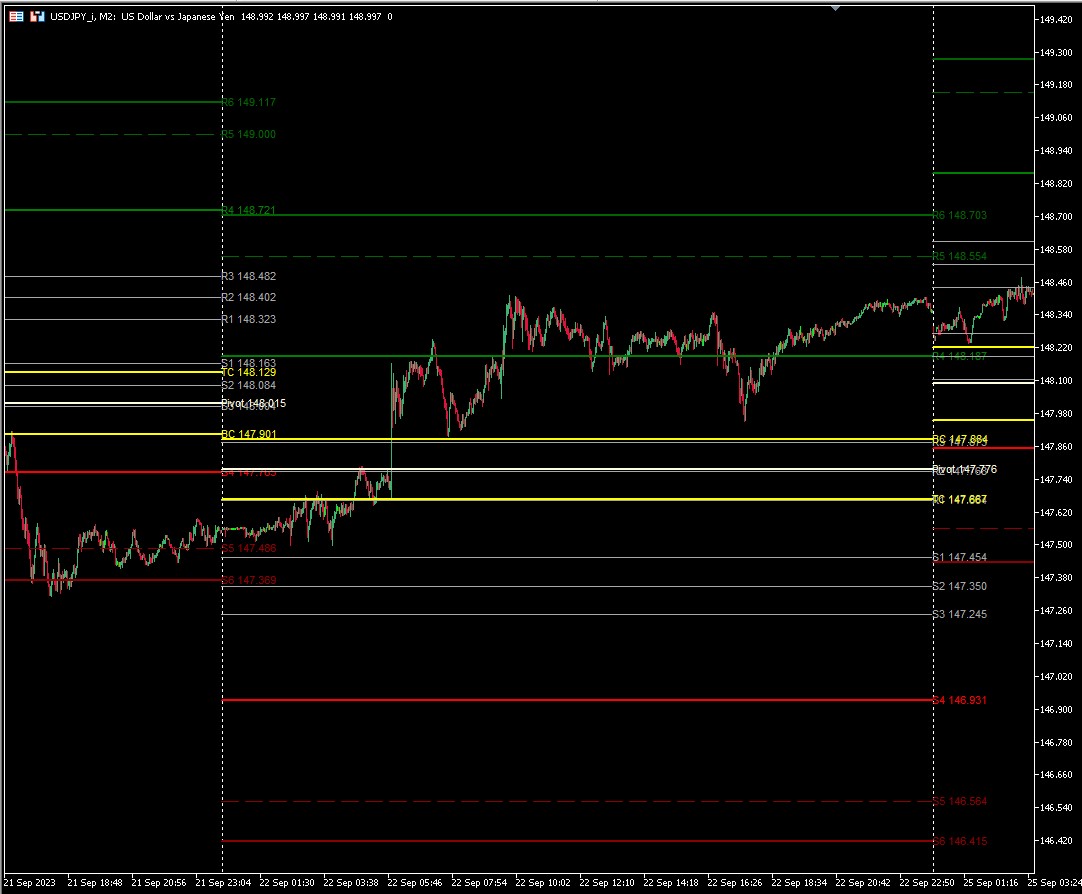
Screenshots
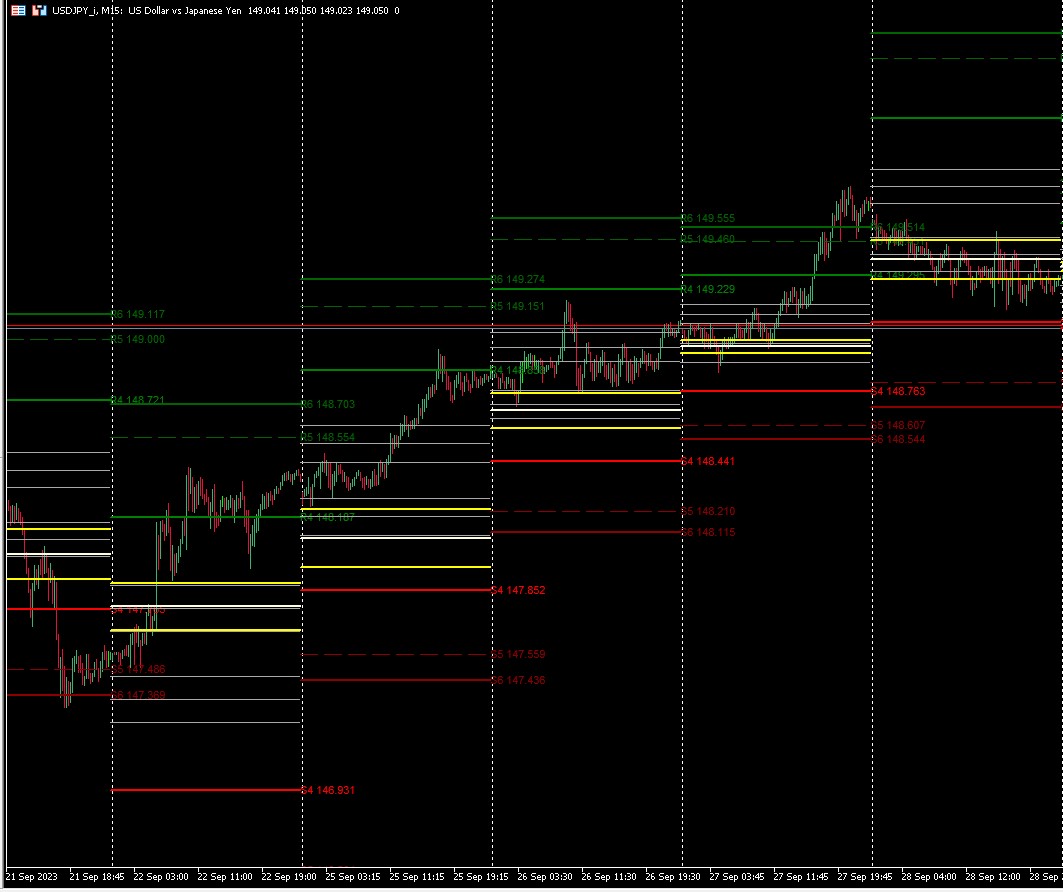
Main interface showing support and resistance levels
Contact & Support
For technical support, bug reports, or feature requests:
- Contact us through the MQL5 Market
- Use the contact form below
- Join our community for discussions and updates
Note: This indicator is provided for educational and informational purposes only. Trading involves risk, and past performance is not indicative of future results.